Debian >> Performance
如何使用Flame Graphs找出耗時的副程式
參考資料:
1. FlameGraph
main.c
#include <stdio.h>
#include <stdlib.h>
#include <unistd.h>

void test1(void)
{
  for(int x=0; x<100; x++);
}

void test2(void)
{
  usleep(1);
}

void test3(void)
{
  usleep(100);
}

int main(int argc, char** argv)
{
  while(1){
    test1();
    test2();
    test3();
  }
}
編譯並且執行
$ gcc main.c -o main -ggdb
$ ./main
使用perf量測(自動量測10秒)
$ perf record -ag -s -d --phys-data -e cpu-cycles:u -F 9999 --call-graph dwarf,8192 -p `pidof ./main` -- sleep 10
    Warning:
    PID/TID switch overriding SYSTEM
    [ perf record: Woken up 1187 times to write data ]
    [ perf record: Captured and wrote 297.243 MB perf.data (36889 samples) ]
P.S. 使用perf量測時,記得要有debug symbol,不然會無法把副程式解析出來
使用Flame Graphs分析
$ git clone https://github.com/brendangregg/FlameGraph
$ cd FlameGraph
$ cp ../perf.data .
$ perf script > out.perf
$ ./stackcollapse-perf.pl out.perf > out.folded
$ ./flamegraph.pl out.folded > perf.svg
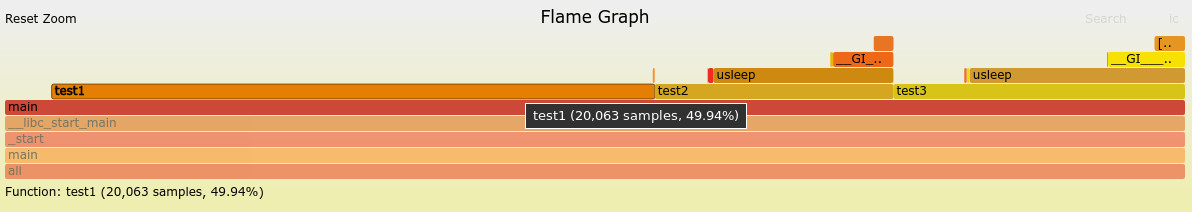
使用Chrome或者Firefox開啟perf.svg,接著就可以使用滑鼠點選想要看的副程式,X軸代表該副程式使用的百分比,Y軸則是呼叫的順序,下張圖片是司徒將滑鼠移到test1所顯示的數據,test1佔了main副程式的49.94%使用率,test1上方沒有任何副程式,代表它是末端,而test1、test2、test3都是由main呼叫使用,test2、test3還往後呼叫了usleep,
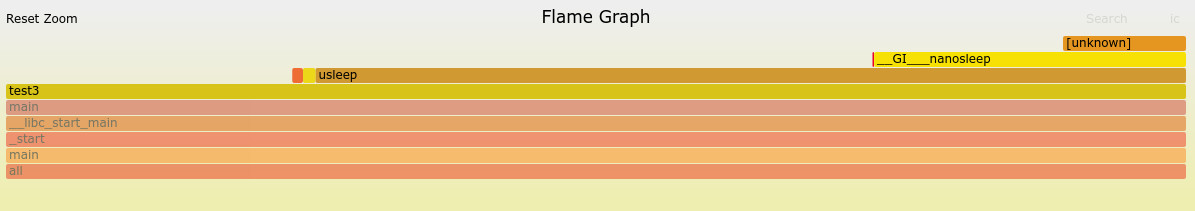
點選test3,可以發現usleep還往後呼叫nanosleep,nanosleep後方因為缺少debug symbol,因此,無法被正確解析出來
P.S. 如要恢復原本的呼叫狀態,只要點選最下方的all即可